Technical Indicators and Technical Analysis
Technical Analysis is based on the belief that 'technical indicators'
give insight into the current and future market situation. A technical indicator
is a function that retrieves information from a time series
of prices or trade volumes, and converts them to an output that can be used as a
trade signal for buying or selling at the right moment. For instance,
the Simple Moving Average (SMA) indicator with
a Time Period 100 adds the last 100 prices and divides the sum
by 100, this way getting the average price of the last 100 bars. If the current
price rises above the average, some traders believe that prices will further rise,
and take this as a buy signal. It the price falls below the average, they believe
that prices will further fall and they must sell.
|
Price 1
|
 |
Indicator
Function |
|
Buy/Sell
Signal |
|
Price 2
|
|
|
Price 3
|
|
|
...
|
|
Price 100
|
|
Indicators usually generate buy or sell signals when they reach a threshold,
cross each other, or cross the price curve. About 1000 different indicators are
published in books and trading magazines, from the very simple to the very bizarre.
The most often used are available in Zorro's indicators and time series library.
The library contains moving averages, oscillators, bands, momentum, strength indices,
divergence, support and resistance, linear and polynomial regression, signal processing,
and machine learning. It is divided in several sections:
- Indicators - common technical indicators, some new,
some old, some useful, listed below in alphabetical order.
- Candle Patterns - library of fixed candle patterns
used by Japanese rice traders in the 18th century.
- Series Analysis - functions for transforming time
series and retrieving statistical and other properties.
- Spectral Analysis - functions for analyzing or
filtering time series by their frequency components and cycles.
- Normalization - functions for scaling and compressing
time series, often needed for machine learning.
- slope, line - functions
for connecting points on the price curve.
- crossOver/Under,
rising/falling,
peak/valley - functions for detecting
events in a time series.
Aside from the indicators and time series functions, price curves and portfolio
performance can also be analyzed with other methods:
Most indicators use the TA-Lib indicator library by Mario Fortier (www.ta-lib.org)
and Zorros indicators.c library. Both are open source and included
in the Zorro\Source folder. The most usual indicator categories are marked:
Mkt = Market State, f.i. for detecting trend or cycle regime,
Avg = Averaging or lowpass filter for
curve smoothing,
Rng = Indicator based on price ratios or differences,
Osc = Oscillator, a measure usually in 0..100 range.
Indicators that do not fall under any above category are not marked.
If you need an indicator that is is missing, simply add it. Most technical indicators
are primitive and can be implemented in a few minutes with a few lines of code. How to implement an
indicator is described in Workshop4a and in the Petra on Programming series on
Financial Hacker.
The file indicators.c contains the source codes of many nonstandard
indicators, so you can use it as learning material for adding more complex indicators.
AC(vars Data): var
Osc
Accelerator Oscillator by Bill Williams; the difference of the AO
indicator (see below) and its 5-bar simple moving average (SMA).
Believed to indicate acceleration and deceleration of a 'market driving force' (whatever
that means). For Data normally a MedPrice
or price series is used. Source code in indicators.c.
ADO(): var
Osc
Accumulation/Distribution Oscillator: ((Close-Low)-(High-Close))/(High-Low).
Ranges from -1 when the close is the low of the bar, to
+1 when it's the high. Supposed to gauge supply and demand by determining
whether traders are generally "accumulating" (buying) or "distributing" (selling).
This indicator was published in many individual variants to the formula, but none
of them seems any better than the other. Uses the current asset price series. Source
code in indicators.c.
ADX(int TimePeriod): var
ADX(vars Open, vars High, vars Low, vars Close, int TimePeriod): var
Osc
Average Directional Movement Index. Moving average of the
DX indicator (see below). The first version uses the current asset price series and does
not support TimeFrame. The returned values range from 0 to 100.
ADXR(int TimePeriod): var
Osc
Average Directional Movement Index Rating. The average of the current ADX
and the ADX from TimePeriod bars ago. Uses the
current asset price series and does not support TimeFrame.
Alligator(vars Data): var
Avg
Alligator Indicator by Bill Willams. Consist of three lines: blue = SMA(13)
delayed by 5 bars; red: SMA(8) delayed by 2 bars; green:
SMA(5). Indicates a down trend with lines in the order blue-red-green
(top to bottom), and an uptrend with green-red-blue. The closer the Alligator’s
lines move, the weaker the trend gets and vice versa. Does not contain the additional
3 bars lag of the original Alligator algorithm (use Data+3 for
that). For Data normally the high/low average (MedPrice
series) is used. Result in rRed, rGreen,
rBlue. Source code in indicators.c.
ALMA(vars Data, int TimePeriod, int Sigma, var Offset): var
ALMA(vars Data, int TimePeriod): var
Arnaud Legoux Moving Average. Based on a Gaussian distribution with a bias towards
the begin of the Data series (i.e. more recent prices). Parameters:
Sigma (distribution width, default 6);
Offset (bias factor, default 0.85). Source code in
indicators.c.
AO(vars Data): var
Avg Awesome Oscillator by Bill Williams; simply the difference of a
5-bar and a 34-bar SMA. For Data normally a
MedPrice or price series is used.
Source code in indicators.c.
APO(vars Data, int FastPeriod, int SlowPeriod, int MAType): var
Osc
Absolute Price Oscillator; a more general version of the AO. Returns
the difference between two moving averages. Parameters: FastPeriod (Number
of period for the fast MA), SlowPeriod (Number of period for the slow MA),
MAType (Type of Moving Average).
Aroon(int TimePeriod): var
Osc
Aroon indicator. Consists of two lines (Up and Down) that measure how long it has
been since the highest high/lowest low has occurred within the time period. Uses
the current asset price series. Does not support TimeFrame. Result
in rAroonDown, rAroonUp.
AroonOsc(int TimePeriod): var
Osc
Aroon Oscillator. Calculated by subtracting the Aroon Down from the Aroon Up. The
return value will oscillate between +100 and -100. Uses the current asset price
series. Does not support TimeFrame.
ATR(int TimePeriod): var
Rng
Average True Range. A measure of price volatility; useful for calculating stop loss
or profit target distances. Formula: ATR = (ATR1 * (TimePeriod-1) + max(High,Close)-min(Low,Close))
/ TimePeriod, where ATR1 is the ATR from
the last bar. Uses the current asset prices. TimeFrame
must be zero or positive. The function internally creates series
when TimeFrame is > 1,
(see remarks). See also:
Volatility, CVolatilty,
TrueRange, ATRS.
ATR(vars Opens, vars Highs, vars Lows, vars Closes, int TimePeriod): var
Rng
Average True Range from arbitrary price series, with arbitrary offset and time frame.
Use this function when TimeFrame is
not constant, but changes from bar to bar, f.i. when skipping bars outside market
hours or aligning to the end of day.
ATRS(int TimePeriod): var
Rng
Simple Average True Range. SMA of the
TrueRange over the TimePeriod,
using the current asset price series. A measure of price volatility, simpler to
calculate than the ATR, but adapting slow to volatility changes
and thus less suited for stop loss / profit targets. Used by the
MTR4 platform instead of the real ATR. Does not support
TimeFrame. Source code in indicators.c.
AvgPrice(): var
Average Price. Simply (Open+High+Low+Close)/4 with the current asset price series.
BBands(vars Data, int TimePeriod, var NbDevUp, var NbDevDn, int MAType)
Bollinger Bands. Consist of three lines; the middle band is a moving average (usually
a 20 periods SMA) of the Data series. The upper
and lower bands are NbDevUp standard deviations above and
NbDevDn standard deviations below the middle band. The bands widen
and narrow when the volatility of the Data series is higher or
lower, respectively. They collapse to a line when the standard deviation is less
than 0.0001. Result in rRealUpperBand, rRealMiddleBand,
rRealLowerBand. Parameters: NbDevUp (Deviation multiplier for upper
band, usually 2), NbDevDn (Deviation multiplier for lower
band, usually 2), MAType (Type of Moving Average, usually
MAType_SMA). Example in Indicatortest.c.
BBOsc(vars Data, int TimePeriod, var NbDev, int MAType): var
Osc
Bollinger Bands Oscillator; the percentage of the current value of the series within
the Bollinger Bands.
Beta(vars Data, vars Data2, int TimePeriod): var
Beta value. A measure of a single asset's prices versus the overall market index.
The asset price is given in Data and the market index price (f.i.
S&P 500, DAX, etc) is given in Data2. The algorithm calculates
the change between prices in both series and then stores these changes as 2-dimensional
points. The x value of any point is the Data2 (market) change and
the y value is the Data (asset) change. The beta value is the slope
of a linear regression line through these points. A beta of 1 is simple the line
y=x, so the asset varies percisely with the market. A beta of less than one means
the asset varies less than the market and a beta of more than one means the asset
varies more than the market.
BOP(): var
Balance Of Power; simply (Close - Open)/(High - Low). Uses the current asset price
series.
CCI(int TimePeriod): var
Osc
Commodity Channel Index. Variation of the price from its statistical mean, typically
oscillates between +/-100. Formula: CCI = (TypPrice-SMA(TypPrice)) / (.015 x SMA(Numerator)). Uses the current asset price series. Does not support
TimeFrame.
CCYI(vars Data, int TimePeriod): var
Ehlers' Correlation Cycle Indicator. Measures the Spearman correlation of the Data series
with a sine wave. Source code in indicators.c. Details on
Financial Hacker.
CCYIR(vars Data, int TimePeriod): var
CCYI rate of change; the first derivative of the CCYI. Source code in indicators.c.
CCYIState(vars Data, int TimePeriod, var Threshold): var
Mkt
Market state based on the CCYI. Measures the phase angle difference between the Data series and a
correlated sine wave, and returns 1 for rising trend regime, -1 for falling trend regime, and 0 for cycle regime.
The critical angle difference in degrees is set with the Threshold parameter (0..45).
Source code in indicators.c. Details on
Financial Hacker.
CI(int TimePeriod): var
Osc
Choppiness Index; measures single bar price volatility in relation to the volatility
of the past TimePeriod in a 1..100 range. Uses the current asset
price series. Does not support TimeFrame.
ChandelierLong(int TimePeriod, var Multiplier): var
ChandelierShort(int TimePeriod, var Multiplier): var
Chandelier exit; the highest price of TimePeriod minus the
ATR multiplied with Multiplier. Normally
used as a trailing Stop Loss, for keeping trades in a trend
and preventing an early exit as long as the trend continues. Source code in
indicators.c. Does not support TimeFrame. Example
in the TMF chapter.
CGOsc(vars Data, int TimePeriod): var
Osc
Center of Gravity oscillator, by John Ehlers; computes the deviation of prices from
their center within the TimePeriod. Can be used to identify price
turning points with almost zero lag. Source code in indicators.c.
Chikou(int Shift): var
Chikou line belonging to the Ichimoku indicator; simply
a delayed Close moved forward by Shift. Uses the current asset
price series. Source code in indicators.c. The traditional Ichimoku
requires a future peeking Chikou line (Shift = -26); this can be
achieved by setting Shift = 0 and moving the rest of the Ichimoku
forward by Offset = 26.
CMO(vars Data, int TimePeriod): var
Osc
Chande Momentum Oscillator. Similar to the RSI,
but divides the total data movement by the net movement ((up - down) / (up + down)).
Coral(vars Data): var
Avg
Coral Indicator, simply a T3 with TimePeriod = 60
and VolumeFactor = 0.4. Source code in indicators.c.
ConnorsRSI(vars Data, int RSIPeriod, int StreakPeriod, int RankPeriod): var
Osc
Indicator by Larry Connors, mean of a 3 period RSI
on Data, a 2 period RSI of the recent up/down streak, and the
percent rank of the recent change. Fluctuates
between 0 and 100 and believed to indicate the overbought (high values) or oversold
(low values) level. The function internally creates series
(see remarks). Source code in indicators.c.
CTI(vars Data, int TimePeriod): var
Ehlers' Correlation Trend Indicator. Measures the Spearman correlation of the Data series
with a rising trend. Source code in indicators.c.
DChannel(int TimePeriod)
Donchian Channel; the minimum and maximum value of the
priceHigh and
priceLow functions over the time period.
Basis of the famous Turtle Trading System. Uses the current asset
price series. Does not support TimeFrame. Result in rRealUpperBand,
rRealLowerBand.
DCOsc(vars Data, int TimePeriod): var
Osc
Donchian Channel Oscillator; the percentage of the current Data
value within the Donchian Channel. Uses the current asset and current
TimeFrame.
Decycle(vars Data, int CutOffPeriod): var
Ehlers' Decycler, a low-lag trend indicator; simply Data -
HighPass2(Data,CutOffPeriod). Removes all cycles
below CutOffPeriod from the Data series and keeps
the trend. The function internally creates series (see remarks). Source code in indicators.c.
DEMA(vars Data, int TimePeriod): var
Avg
Double Exponential Moving Average.
Divergence(vars Highs, vars Lows, vars Data, int TimePeriod): int
Mkt
Regular or hidden divergence. Draws lines through the two most prominent peaks and
valleys of the Highs and Lows series, and compares with lines through the
two most prominent valleys and peaks of the Data series within
the TimePeriod. Highs and Lows are usually from a price curve, while
Data is
from an oscillating indicator,
such as MACD, CCI, RSI,
Stoch, etc. Some traders believe that
a divergence between the lines predicts a trend change. Bullish regular divergence
means that the price makes lower lows, while the oscillator does not. Bearish
regular divergence means that the price makes higher highs, while the oscillator
does not. Bullish hidden divergence means that the oscillator makes
higher highs, while the price does not. Bearish hidden divergence
means that the oscillator makes lower lows, while the price does not. The function
returns:
0 - No divergence
1 - Bullish regular
divergence
2 - Bearish regular divergence
4
- Bullish hidden divergence
8 - Bearish hidden divergence.
The returned value can be a combination, f.i. 5 = 1+4
= bullish regular + bullish hidden divergence. All combinations are possible.
The slope of the determining line (movement per bar)
is stored in rSlope. Source code in indicators.c.
DPO(vars Data, int TimePeriod): var
Osc
Detrended Price Oscillator; believed to detect early changes in price direction.
DPO = Data[0] - SMA(Data[n/2+1],n), where n is
the TimePeriod. Source code in indicators.c.
DX(int TimePeriod): var
DX(vars Open, vars High, vars Low, vars Close, int TimePeriod): var
Osc Directional Movement Index by Welles Wilder,
who discovered
that "the interaction of sun, moon, and earth is the basis of all market movement".
In case that celestial bodies refrain from moving the market,
he also invented the DX, which he believed to indicate trend strength. The values
range from 0 to 100, but rarely get above 60. The first DX
version uses the current
asset price series and does not support TimeFrame. Formula:
DX = 100 * abs(PlusDI-MinusDI) / (PlusDI+MinusDI). For
PlusDI and MinusDI
see the description below.
EMA(vars Data, int TimePeriod): var
Avg
Exponential Moving Average. Emphasizes more recent data values. It uses the formula
EMA = alpha * data + (1-alpha) * EMA1, where alpha
is 2.0/(TimePeriod+1), and EMA1 is the previous
EMA value. The higher the time period, the smaller is alpha and the higher is the smoothing effect
of the EMA formula. The function requires a Data length of TimePeriod+UnstablePeriod+1.
EMA(var Input, int TimePeriod): var
EMA(var Input, var alpha): var
Avg
Exponential Moving Average as above, alternative version that uses a single variable as input
and also accepts the alpha parameter (see above). Does not use UnstablePeriod,
but creates an internal series.
ER(vars Data, int TimePeriod): var
Osc
Kaufman's Efficiency Ratio, the amount of price changes in the given interval in
relation to the absolute price change. Source code in indicators.c.
FractalHigh(vars Data, int TimePeriod): var
Fractal High, an indicator by Bill Williams, believed to signal when the market
reverses (has nothing to do with fractals). Returns the highest Data
value when it is in the center of the TimePeriod, otherwise
0.
FractalLow(vars Data, int TimePeriod): var
Fractal Low. Returns the lowest Data value when it is in the center
of the TimePeriod, otherwise 0.
HAOpen(): var
HAClose(): var
HAHigh(): var
HALow(): var
Haiken Ashi prices of the current bar, based on the current asset prices. Except for
HAClose, the functions internally create series (see remarks). Source code in indicators.c.
HH(int TimePeriod, int Offset): var
Highest value of the priceHigh function
over the TimePeriod ending with Offset (default
0). F.i. HH(3,1) returns the highest price of
the 3 bars before the current bar. Uses the current asset price series. Sets
rMaxIdx to the bar offset with the highest price.
TimeFrame > 1 is supported. Source code in indicators.c.
See also dayHigh.
HMA(vars Data, int TimePeriod): var
Avg
Hull Moving Average by Alan Hull; attempts to address lag as well as to smooth out
some choppiness. Formula:HMA(n) = WMA(2*WMA(n/2) – WMA(n)),sqrt(n)).
The function internally creates a series (see remarks). Source code in indicators.c.
HTDcPeriod(vars Data): var
Osc
Hilbert Transform - Dominant Cycle Period, developed by John Ehlers. Hilbert transform
algorithms are explained in Ehler's book "Rocket Science for Traders"
(see book list). This function is equivalent, but less accurate
than the DominantPeriod function.
HTDcPhase(vars Data): var
Osc
Hilbert Transform - Dominant Cycle Phase.HTPhasor(vars Data): var
Hilbert Transform - Phasor Components. Result in rInPhase, rQuadrature.
HTSine(vars Data): var
Osc
Hilbert Transform - SineWave. Result in rSine, rLeadSine.HTTrendline(vars
Data): var
Avg
Hilbert Transform - Instantaneous Trendline.HTTrendMode(vars Data): int
Mkt
Hilbert Transform trend indicator - returns 1 for Trend Mode,
0 for Cycle Mode.
IBS(): var
Osc
Internal Bar Strength; relative position in percent of the close price with respect
to the low to high range for the same period. Source code in indicators.c.
Ichimoku()
Ichimoku(int PeriodTenkan, int PeriodKijun, int PeriodSenkou, int Offset)
Avg
Ichimoku Kinko Hyo indicator. Invented by the journalist Goichi Hosoda in the 1930s,
and today again in fashion due to its enormous number of colorful lines. The Ichimoku
is a mix of the medium prices of 3 time periods. Offset (default
0) determines the bar for calculating the indicator, and can be used to shift all
lines forward. The function returns 4 variables:
rTenkan = (HH+LL)/2
with PeriodTenkan (default 9)
rKijun
= (HH+LL)/2 with PeriodKijun (default 26)
rSenkouA = (rTenkan+rKijun)/2, shifted forward by PeriodKijun.
Forms a "cloud band" with rSenkouB.
rSenkouB
= (HH+LL)/2 with PeriodSenkou (default 52),
shifted forward by PeriodKijun
Another line belonging to
the Ichimoku, the Chikou line, is future
peeking and calculated separately. The function uses the current asset price series.
It internally creates series when
TimeFrame is > 1
(see remarks). Source code in indicators.c.
KAMA(vars Data, int TimePeriod): var
Avg
Kaufman Adaptive Moving Average. An exponential moving average adjusted by price
volatility, so its time period becomes shorter when volatility is high.
KAMA2(vars Data, int ERPeriod, int FastPeriod, int SlowPeriod): var
Avg
Kaufman Adaptive Moving Average as above, but the volatilty detection period as
well as the short and long time period can be set separately. Internally creates
series (see remarks).
Source code in indicators.c.
Keltner(vars Data, int TimePeriod, var Factor): var
Avg
Keltner Channel, by Charles Keltner. A Simple Moving Average - SMA(Data,TimePeriod)
- with side bands in the distance Factor * ATRS(TimePeriod). Results
in rRealUpperBand, rRealMiddleBand, rRealLowerBand. Source
code in indicators.c.
LL(int TimePeriod, int Offset): var
Lowest value of the priceLow function over
the TimePeriod ending with Offset (default
0). F.i. LL(3,10) returns the lowest price between
the last 10 and the last 13 bars. Uses the current asset price series. Sets
rMinIdx to the bar offset with the lowest price.
TimeFrame > 1 is supported. Source code in indicators.c.
See also dayLow.
LSMA(vars Data, int TimePeriod, int Offset): var
Avg
Least Squares Moving Average. Calculates a linear regression line over the recent
TimePeriod, and returns the value of that line at the given bar
Offset (0 for the current bar). Negative offsets
return future values of the regression line and can be used for forecasting. See
also QLSMA, polyfit,
LinearReg, predict. Source
code in indicators.c.
MACD(vars Data, int FastPeriod, int SlowPeriod, int SignalPeriod)
Rng
Moving Average Convergence/Divergence. The MACD is an intermediate-term
trend indicator, created by subtracting a 26-period Exponential Moving Average (EMA,
see above) from a 12-period EMA. A nine-period EMA
is then applied to the MACD result to create a 'signal line'. A
MACD Histogram line is finally created from the difference of the
MACD to its signal line. It is believed that the zero crossing
of the histogram from below is a buy signal, zero crossing from above a sell signal.
The formula is:
rMACD = EMA(Data,FastPeriod)-EMA(Data,SlowPeriod);
rMACDSignal = EMA(rMACD,SignalPeriod);
rMACDHist = rMACD - rMACDSignal;
Results in rMACD, rMACDSignal, rMACDHist. Returns: rMACD.
Parameters: FastPeriod (time period for the fast MA), SlowPeriod (time
period for the slow MA), SignalPeriod (time period for smoothing the signal
line).
MACDExt(vars Data, int FastPeriod, int FastMAType, int SlowPeriod, int SlowMAType,
int SignalPeriod, int SignalMAType)
Rng
MACD with controllable MA type. Result in rMACD, rMACDSignal, rMACDHist.
Parameters: FastPeriod (time period for the fast MA), FastMAType (Type
of Moving Average for fast MA), SlowPeriod (time period for the slow MA),
SlowMAType (Type of Moving Average for slow MA), SignalPeriod (time
period for smoothing the signal line), SignalMAType (Type of Moving Average
for signal line).
MACDFix(vars Data, int SignalPeriod)
Rng
Moving Average Convergence/Divergence Fix 12/26. Result in rMACD, rMACDSignal,
rMACDHist. Parameters: SignalPeriod (time period for smoothing the
signal line).
MAMA(vars Data, var FastLimit, var SlowLimit)
Avg
MESA Adaptive Moving Average, developed by John Ehlers (see
links). Result in rMAMA, rFAMA. Parameters: FastLimit (Upper
limit use in the adaptive algorithm), SlowLimit (Lower limit use in the adaptive
algorithm).
MedPrice(): var
Center price; simply the center point (High+Low)/2
of the current candle. For the mean price - the average of all price ticks of the
candle - use price(). For the middle price between Ask and
Bid, take the ask price and add Spread/2.
MidPoint(vars Data, int TimePeriod): var
MidPoint over period. Simply (highest value + lowest value)/2.
MidPrice(int TimePeriod): var
Midpoint price over period. Simply (highest high + lowest low)/2 of the current
asset price series. Does not support TimeFrame.
MinusDI(int TimePeriod): var
MinusDI(vars Open, vars High, vars Low, vars Close, int TimePeriod): var
Osc Minus Directional Indicator, part of the
DX indicator, ratio of a smoothed MinusDM
to ATR in percent. If the function is not called with different
price series, the current asset price series is used.
MinusDM(int TimePeriod): var
MinusDM(vars Open, vars High, vars Low, vars Close, int TimePeriod): var
Rng Minus Directional Movement, the difference of
current low and previous low. In the first version the current asset price series is used.
MMI(vars Data, int TimePeriod): var
Mkt
Market Meanness Index by
Financial Hacker. Measures the mean reversal tendency of the market in a 0..100% range. Random numbers have a MMI of 75%.
Real prices are more or less autocorrelated, so the probability of a real price
series to revert to the mean is less than 75%, but normally more than 50%. The higher
it is, the 'meaner' the market behaves towards trend following systems. The Market Meanness
Index can determine when trend following systems will become more profitable (MMI
is falling) or less profitable (MMI is rising), and thus prevent losses in unprofitable
periods. Source code in indicators.c.
Mom(vars Data, int TimePeriod): var
Rng
Momentum. Simply Data[0] - Data[TimePeriod]. See also
RET and
diff.
MovingAverage(vars Data, int TimePeriod, int MAType): var
Avg
Moving average. Parameters: MAType (Type of Moving Average, see remarks).
MovingAverageVariablePeriod(vars Data, vars Periods, int MinPeriod, int MaxPeriod,
int MAType): var
Avg
Moving average with variable period given by the Periods series.
Parameters: MinPeriod (Value less than minimum will be changed to Minimum
period), MaxPeriod (Value higher than maximum will be changed to Maximum
period), MAType (Type of Moving Average, see remarks).
NATR (int TimePeriod): var
Osc
Normalized Average True Range, by John Forman. Similar to the ATR, except it is
being normalized as follows: NATR = 100 * ATR(TimePeriod) / Close.
Uses the current asset price series. Does not support TimeFrame.
NumWhiteBlack (var Body, int Offset, int TimePeriod): var
Number of white minus number of black candles in the given TimePeriod.
Offset is the distance to the current bar (0 =
current bar), Body is the minimum length of a candle to be counted.
Source code in indicators.c.
OBV (vars Data, var Volume): var
On Balance Volume, by Joseph Granville. The cumulative difference of the up and
down volume. Data is normally a Close series, Volume
can be taken from marketVol. Because it is cumulative, its
absolute value depends on the start date and previous history. Source code in
indicators.c.
Pivot (int TimePeriod, int Offset)
The 'pivot point' (High+Low+Close)/3 of the given TimePeriod
at the given bar Offset. Uses the current asset time series, but
TimeFrame is supported. See also dayPivot.
Source code in indicators.c.
PlusDI (int TimePeriod): var
PlusDI (vars Open, vars High, vars Low, vars Close, int TimePeriod): var
Osc Plus Directional Indicator, a part of the
DX indicator, ratio of a smoothed PlusDM
to ATR in percent. In the first version the current
asset price series is used.
PlusDM (int TimePeriod): var
PlusDM (vars Open, vars High, vars Low, vars Close, int TimePeriod): var
Rng
Plus Directional Movement, the difference of current high and previous high. In the first version the current asset
price series is used.
PPO(vars Data, int FastPeriod, int SlowPeriod, int MAType): var
Osc
Percentage Price Oscillator, the normalized difference of two averages. Parameters: FastPeriod (Number of period for
the fast MA), SlowPeriod (Number of period for the slow MA), MAType
(Type of Moving Average).
ProfitFactor(vars Data, int Length): var
Returns the profit factor of the Data series. The profit factor
is the ratio of the sum of positive returns (i.e. Data[i-1] > Data[i])
to the sum of negative returns (Data[i-1] < Data[i]). The returned
value is clipped to the 0.1...10 range. Use its reciprocal when
the Data array is in not in series order,
but in ascending order, as wins and losses are then swapped. Source available in
indicators.c.
QLSMA(vars Data, int TimePeriod, int Offset): var
Avg
Quadratic Least Squares Moving Average. Calculates a parabolic regression curve
over the recent TimePeriod, and returns the value of that curve
at the given bar Offset (0 for the current bar).
Negative offsets return future values of the regression curve and can be used for
forecasting. See also LSMA, polyfit,
LinearReg, predict. Source
code in indicators.c.
Resistance(vars Data, int TimePeriod): var
Resistance line; returns the average of the two highest Data peaks
in the TimePeriod, or 0 when no peaks are found.
The slope (Data difference per bar) of the line through the two
peaks is stored in rSlope and can be used to determine if the resistance
line is flat enough. See also Support, Divergence,
pivot levels. Source code in indicators.c.
RET(int TimePeriod): var
Rng
Return of the current asset: (Close(0)-Close(TimePeriod))/Close(TimePeriod).
Source code in indicators.c
ROC(vars Data, int TimePeriod): var
Rng
Rate of change, 100 scale: ((price-prevPrice)/prevPrice)*100.
ROCP(vars Data, int TimePeriod): var
Rng
Rate of change: (price-prevPrice)/prevPrice. See also
diff.
ROCR(vars Data, int TimePeriod): var
Rng
Rate of change ratio: (price/prevPrice).
ROCR100(vars Data, int TimePeriod): var
Rng
Rate of change ratio, 100 scale: (price/prevPrice)*100.
ROCL(vars Data, int TimePeriod): var
Rng
Logarithmic return: log(price/prevPrice).
Roof(vars Data, int CutoffLow, int CutoffHigh): var
Avg
Ehlers' roofing filter, prepares the Data series for further computation
by removing trend and noise. Applies a 2-pole highpass filter followed by the
Smooth filter. Recommended values for the low and high cutoff periods
are 10 and 50. The minimum length of the
Data series is 2. The function internally creates
series (see remarks). Source available in indicators.c.
RSI(vars Data, int TimePeriod): var
Osc Relative Strength Index, by Welles Wilder. Ratio of the recent
upwards data movement to the total data movement; range 0..100. The RSI is believed
to indicate overbought/oversold conditions when the value is over 70/below 30. Formula:
RSI = 100 * Up/(Up+Dn), where Up = EMA(max(0,Data[0]-Data[1]),TimePeriod)
and Dn = EMA(max(0,Data[1]-Data[0]),TimePeriod).
RSIS(vars Data, int TimePeriod): var
Osc Relative Strength Index variant, using the simple average of
the Up/Dn sums instead of an EMA. This RSI variant is used by several trading platforms
instead of the original version.
RVI(int TimePeriod): var
Osc
Relative Vigor Index, by John Ehlers. Ratio of price change to the total price range:
(C-O)/(H-L), averaged over the time period and smoothed with a
FIR filter. Oscillates between -1 and 1. The function
internally creates a series (see remarks). Source code in indicators.c.
SAR(var Step, var Min, var Max): var
Parabolic SAR by Welles Wilder. The SAR runs above or below the price curve, depending
on the current trend; each price curve crossing is believed to indicate a trend
change. Parameters: Step (acceleration factor increment, normally
0.02), Min (acceleration factor minimum value, normally
0.02), Max (acceleration factor maximum value, normally
0.2). SAR is a recursive function that depends on the
direction of the initial price candle; for consistent values the
LookBack period should be long enough to contain at least
one price curve crossing. Uses the current asset prices. The function internally
creates a series (see remarks). Source code in indicators.c, example in
Indicatortest.c.
SentimentLW(int TimePeriod): var
Osc
Market Sentiment Index by Larry Williams, based on the averaged differences of day
closes to day highs/lows. Returns a 0..100 percentage. Williams believed that a
high index indicates a bullish market saturation and predicts sells, while a low
index indicates no bullishness and predicts buys. Uses the current asset prices.
The function internally creates a series (see remarks). Source code in indicators.c.
SentimentG(int TimePeriod): var
Osc
Genesis Sentiment Index, the current price in relation to the given TimePeriod,
usually 6 months. Returns a 0..100 percentage; believed to indicate a bullish market
with a high index and bearishness with a low index. Uses the current asset prices.
The function internally creates a series (see remarks). Source code in indicators.c.
Sharpe(vars Data, int TimePeriod): var
Sharpe ratio; the mean of the Data series divided by its standard
deviation. Source code in indicators.c.
SIROC(vars Data, int TimePeriod, int EMAPeriod): var
Rng
Smoothed Rate of Change (S-RoC) by Fred G Schutzman. Differs from the ROC
(see above) in that it is based on the exponential moving average (EMA)
of the Data series. Believed to indicate the strength of a trend
by determining if the trend is accelerating or decelerating. Formula: (Current EMA
- Previous EMA)/(Previous EMA) x 100. Source code in indicators.c.
SMA(vars Data, int TimePeriod): var
Avg Simple Moving Average; the mean of the Data
series, i.e. the sum of all elementes divided
by the time period. Use Moment when long
time periods are required.
SMAP(vars Data, int TimePeriod): var
Avg
Mean of Data as above, but counting only nonzero positive values.
Can be used to skip inactive periods f.i. for calculating the average volume. Source
code in indicators.c.
Smooth(vars Data, int CutoffPeriod): var
Avg
Ehlers' 'Super Smoother' filter, a 2-pole Butterworth filter combined with a
SMA that suppresses the Nyquist frequency.
Can be used as a low-lag universal filter for removing noise from price data. The
minimum length of the Data series is 2. The function internally
creates series (see remarks). Source available in indicators.c.SMom(vars Data,
int TimePeriod, int CutoffPeriod): var
Rng
Smoothed Momentum by John Ehlers; indicates the long term trend direction.
TimePeriod is the momentum period, CutoffPeriod
is a Butterworth filter constant for lowpass filtering the momentum. Source code
in indicators.c.
Sortino(vars Data, int TimePeriod): var
Sortino ratio; the mean of the Data series divided by its semi-deviation,
i.e. by the standard deviation of Data values below the mean. Source
code in indicators.c.
Stoch(int FastK_Period, int SlowK_Period, int SlowK_MAType, int SlowD_Period,
int SlowD_MAType)
Stoch(vars Open, vars High, vars Low, vars Close, int FastK_Period, int SlowK_Period,
int SlowK_MAType, int SlowD_Period, int SlowD_MAType)
Osc Stochastic Oscillator (not related to
stochastic, but its inventor,
George Lane, looked for an impressive name). Measures where the Close price is in relation
to the recent trading range. Formula: FastK = 100 * (Close-LL)/(HH-LL);
SlowK = MA(FastK); SlowD = MA(SlowK). Some traders
believe that the SlowK crossing above SlowD is
a buy signal; others believe they should buy when SlowD is below
20 and sell when it is above 80. Two versions; the first version uses the current
asset price series and does not support TimeFrame. Result in
rSlowK, rSlowD. Returns SlowD. Parameters:
FastK_Period - Time period for
the HH and LL to generate the FastK
value, usually 14.
SlowK_Period - Time period for smoothing
FastK to generate rSlowK; usually 3.
SlowK_MAType - Type of Moving Average for Slow-K, usually MAType_SMA.
SlowD_Period - Time period for smoothing rSlowK to generate rSlowD,
usually 3.
SlowD_MAType - Type of Moving Average for
Slow-D, usually MAType_SMA.
StochEhlers(vars Data, int TimePeriod, int CutOffLow, int CutOffHigh): var
Osc
Predictive stochastic oscillator by John Ehlers. Measures where the Data
value is in relation to its range within TimePeriod. The data runs
through a 2-pole highpass filter with period CutOffHigh and through
a Butterworth lowpass filter with period CutOffLow. Indicator algorithm
explained in Ehler's "Predictive Indicators" paper; usage example in the
Ehlers script. Source code in indicators.c.
The function internally creates series (see remarks).
StochF(int FastK_Period, int FastD_Period, int FastD_MAType): var
Osc
Stochastic Fast; Stoch without the SlowK part. Measures where the Close price is in relation to the recent trading
range; Formula: Fast-K = 100 * (Close-LL)/(HH-LL); Fast-D
= MA(Fast-K). Uses the current asset price series, and does not support
TimeFrame. Results in rFastK, rFastD. Returns
FastD. Parameters:
FastK_Period (Time period for the
HH and LL of Fast-K, usually 14),
FastD_Period (Moving Average Period for Fast-D; usually 3),
FastD_MAType (Type of Moving Average for Fast-D, usually MAType_SMA).
StochRSI(vars Data, int TimePeriod, int FastK_Period, int FastD_Period, int
FastD_MAType): var
Osc
Stochastic Relative Strength Index. The fast Stoch applied to
the RSI in hope to get an even better result. Results in rFastK,
rFastD. Returns FastD. Parameters:
TimePeriod
- for the RSI, usually 14,
FastK_Period - Time period for building the Fast-K line,
usually 14,
FastD_Period - Smoothing for
making the Fast-D line, usually 3,
FastD_MAType - Type of Moving
Average for Fast-D,usually MAType_SMA).
Support(vars Data, int TimePeriod): var
Support line; returns the average of the two lowest Data valleys
in the TimePeriod, or 0 when no valleys are found.
The slope (Data change per bar) of the line through the two
valleys is stored in rSlope and can be used to determine if the
support line is flat enough. See also Resistance, Divergence,
pivot levels. Source code in indicators.c.
T3(vars Data, int TimePeriod, var VFactor): var
Avg An extremely smoothed Moving Average by Tim Tillson. Uses
a weighted sum of multiple EMAs. Parameters: VFactor (Volume Factor, normally
0.7).
TEMA(vars Data, int TimePeriod): var
Avg
Triple Exponential Moving Average by Patrick Mulloy, calculated from (3xEMA)-(3xEMA
of EMA)+(EMA of EMA of EMA).
Trima(vars Data, int TimePeriod): var
Avg
Triangular Moving Average (also known under the name TMA); a form
of Weighted Moving Average where the weights are assigned in a triangular pattern.
F.i. the weights for a 7 period Triangular Moving Average would be 1, 2, 3, 4, 3,
2, 1. This gives more weight to the middle of the time series. It causes better
smoothing, but greater lag.
Trix(vars Data, int TimePeriod): var
1-day Rate-Of-Change (see ROC) of a Triple EMA (see TEMA).
TrueRange(): var
Rng True Range (TR); max(High[0],Close[1])-min(Low[0],Close[1])
of the current asset price series. See also ATR, ATRS.
TSI(vars Data, int TimePeriod): var
Mkt
Trend Strength Index, an indicator by Frank Hassler who believed that it identifies
trend strength. A high TSI value (above ~ 1.65) indicates that
short-term trend continuation is more likely than short-term trend reversal. The
function internally creates series (see remarks).
TypPrice(): var
Typical Price. Simply (High + Low + Close)/3. Uses the current
asset price series.
UltOsc(int TimePeriod1, int TimePeriod2, int TimePeriod3): var
Osc
Ultimate Oscillator. Parameters: TimePeriod1 (Number of bars for 1st period.),
TimePeriod2 (Number of bars for 2nd period), TimePeriod3 (Number of
bars for 3rd period). Uses the current asset price series. Does not support
TimeFrame.
UO(vars Data, int CutOff): var
Osc
Universal oscillator by John Ehlers, from S&C Magazine 1/2015. Removes white
noise from the data, smoothes it and runs it through the AGC
filter. Detects trend reversals very early. Output in the -1..+1 range. Source code
in indicators.c. The function internally creates
series (see remarks).
Volatility(vars Data, int TimePeriod): var
Annualized volatility of the Data series; standard deviation of
the logarithmic returns, multiplied with the square root of time frames in a year.
Data must be a series of positive values, normally a price
series. This is the standard measure of volatility used in financial models, such as the
Black-Scholes model.
For irregular Data series, corrections can be required to annualize the volatilty for all
time frames. If Data contains flat out-of-market periods, multiply the result with
the square root of trading bars per day divided by bar periods per day (example:
with 60 minute bars and 8 trading bars per day, multiply with sqrt(8./24)
= 0.58). If Data has a variable number
of bars per element by time frame synchronizing (frameSync),
divide the result by the square root of the average bars per time frame.
The function internally creates series
(see remarks). Source code in indicators.c.
A practical alternative for options calculations is VolatilityOV.
VolatilityC(int TimePeriod, int EMAPeriod): var
Rng
Chaikin Volatility indicator by
Marc Chaikin; measures volatility in percent as momentum of the smoothed
difference between High and Low. An increase in the Chaikin Volatility indicates
that a bottom is approaching, a decrease indicates that a top is approaching.
TimePeriod is the period of the momentum (normally 10),
EMAPeriod determines the smoothing (also, normally 10). Uses the current
asset price series. The function internally creates series
(see remarks). Source code in indicators.c.
VolatilityMM(vars Data, int TimePeriod, int EMAPeriod): var
Rng
Min/Max volatility of the Data series; the difference of
MaxVal and MinVal in the time period, smoothed
by an EMA (set EMAPeriod = 0 for no smoothing). The function internally
creates a series when EMAPeriod > 0
(see remarks). Source available in
indicators.c. For the volatility of price candles, use
ATR or ATRS.
VolatilityOV(int Days): var
Annualized volatility of the current asset, calculated over the given number of
Days (usually 20) regardless of the bar period. Empirical formula
used by options software packages (OptionVue™)
for estimating the values of options, alternatively to Volatility().
Source code in contract.c, which must be included for using this
indicator.
VolatilityP(int Days): var
Parkinson volatility of the current asset, calculated over the given number of
Days (usually 10) regardless of the bar period. The Parkinson
Volatility is the normalized square root of the natural logarithm of the ratio
of the daily high to low.
Source code in indicators.c.
VWAV(vars Data, vars Weights, int TimePeriod): var
Avg
Volume Weighted Average Value, the scalar product of Data and 1-normalized
Weights with length TimePeriod. Can be used to
calculate a volume averaged price (VWAP) by setting Data to a price
series and Weights to a corresponding volume series, f.i.
vars Prices = series(priceClose()); vars Volumes = series(marketVol());
var VWAP = VWAV(Prices,Volumes,Period); (Zorro S required). Source code
in indicators.c.
WCLPrice(): var
Weighted Close Price, the average of High, Low, and twice the Close. Uses the current
asset price series.
WillR(int TimePeriod): var
Rng
Williams' Percent Range. Formula: -100* (HH-Close)/(HH-LL). Uses
the current asset price series. Does not support TimeFrame.
WMA(vars Data, int TimePeriod): var
Avg
Linear Weighted Moving Average; the weight of every bar decreases linearly with
its age.
ZigZag(vars Data, var Depth, int Length, int Color): var
ZigZag indicator; converts the Data series into alternating straight
'legs' with at least the given Depth (in Data units) and Length (in bar units).
For not missing legs, the Depth threshold should be sufficient
low. ZigZag is non-predictive
and can only identify trends in hindsight. Returned: rSlope (the
slope of the last identified leg; upwards legs have a positive slope, downwards
legs a negative slope); rPeak (the bar offset of the last
identified peak); rLength
(the number of bars of the last zig or zag that ends with rPeak).
If a nonzero Color is given, the zigzag lines are plotted in the
chart. Source code in indicators.c, example in Indicatortest.c.
The function internally creates series (see remarks).
ZMA(vars Data, int TimePeriod): var
Avg
Zero-lag Moving Average by John Ehlers; smoothes the Data series
with an Exponential Moving Average (EMA) and applies an error
correction term for compensating the lag. The function internally creates a
series (see remarks). Source in indicators.c.
Standard parameters:
| TimePeriod |
The number of bars for the time period of the function,
if any; or 0 for using a default period. |
| MAType |
The type of the moving average used by the function:
MAType_SMA (default), MAType_EMA,
MAType_WMA, MAType_DEMA, MAType_TEMA,
MAType_TRIMA, MAType_KAMA, MAType_MAMA,
MAType_T3. |
| Data |
A data series in descending order (newest data
first), normally derived from the price functions
price(), priceC() etc. Alternatively
a user created series or any other double float array with the given minimum
length. If not mentioned otherwise, the minimum length of the Data
series is normally TimePeriod (see remarks). Some functions require a second data
series Data2. |
Open, High,
Low, Close |
Price data series can be explicitly given for
some indicators, for using price series generated from a different asset
or with a different TimeFrame. Otherwise the
prices of the current asset with a time frame equivalent to the bar period
are used. |
Returns:
Price variation or percentage, dependent on the function, for the current bar.
Usage example:
MACD(Price,12,26,9) calculates the standard MACD for the given
Price series. The results are stored in the global variables
rMACD, rMACDSignal, and rMACDHistory.
Remarks:
- The TA-Lib function prototypes are defined in include\functions.h.
The C++ source code of all included TA-Lib indicators is available in Source\ta_lib.zip. Some TA-Lib indicators that
originally didn't work properly - such as Correlation or SAR - have been replaced
by working versions. The C source code of most additional indicators that
are not part the the TA-Lib is contained in Source\indicators.c.
- TA-Lib indicators can only be used between INITRUN
and EXITRUN, since TA-Lib and series management are released at end of the
session. This restriction does not apply when the
STRAIGHT flag is set.
- All indicators are normally applied either on data series,
or on the price curve of the current asset. In the INITRUN,
indicators
return 0 and LookBack is
automatically
increased to the largest required lookback time by any used
indicator. Data series must
cover at least the indicator's lookback period, which is not always
identical to the given TimePeriod. If the required lookback
period by any indicator exceeds LookBack after
the INITRUN, an Error 046 message
will be issued. Make sure that
LookBack is always higher than the maximum
TimePeriod plus the UnstablePeriod of all
indicators plus the
highest offset of all used series.
- Some TA functions internally create data series, and thus
must be called the same number of times and in the same order at any bar.
They must therefore not depend on if conditions.
- Recursive indicators - f.i. EMA or
ATR - use a preceding value of itself as an input. Their results
thus depend on their previous history. Recursive functions from the TA-Lib
run over the whole UnstablePeriod at any call. This ensures
reproducible results regardless of the number of preceding bars, but requires a longer lookback period and increases the
backtest time. Recursive functions that are not from the TA-Lib (f.i.
LowPass)
do not use this mechanism, but store their values from preceding calls in an
internal series instead.
- Some indicators return more than one value, f.i. MACD. The
returned results are stored in global variables beginning with "r";
they can be accessed after the function is called.
- TimeFrame affects subsequent data
series and thus also affects all indicators that use
these data series as input. The TimePeriod is then not in Bar
units, but in time frame units. TimeFrame has no effect on
indicators that do not use data series. The required lookback period of an
indicator multiplies with the TimeFrame of its series.
- The MAType can be any of MAType_SMA,
MAType_EMA, MAType_WMA, MAType_DEMA, MAType_TEMA, MAType_TRIMA, MAType_KAMA, MAType_MAMA, MAType_T3.
- Indicators that rely on the standard deviation (f.i. Bollinger Bands) become
inaccurate when the standard deviation is below 0.0001, as it is then assumed
to be zero by the TA-Lib. This can happen on very short bar periods when the
price does (almost) not move.
- For writing your own indicators, have a look
at workshop 4a and at the examples inside
indicators.c. But please do not modify indicators.c
- write the indicators in your own script, or in a dedicated script that you
can then include in your strategies. If you need a
complex indicator that you can not be easily add, please ask for it on the Zorro
user forum.
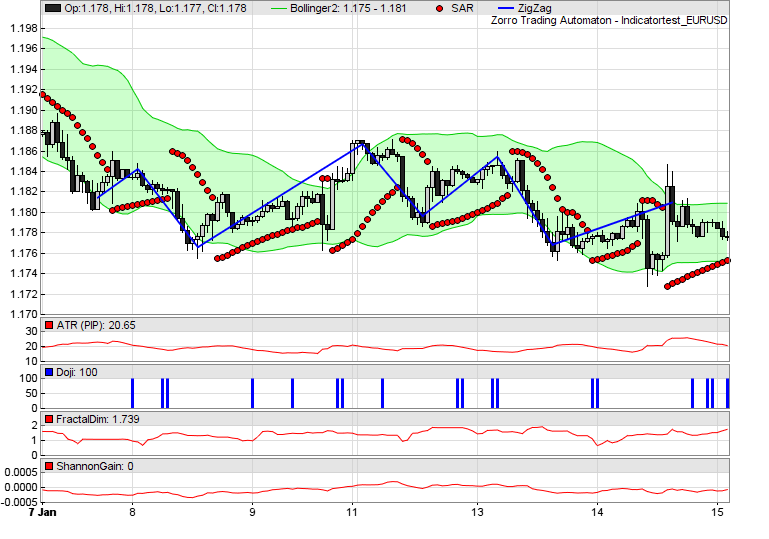
Examples:
// plot some indicators
function run()
{
  set(PLOTNOW);
  var* Price = series(price());

// plot Bollinger bands
  BBands(Price,30,2,2,MAType_SMA);
  plot("Bollinger1",rRealUpperBand,BAND1,0x00CC00);
  plot("Bollinger2",rRealLowerBand,BAND2,0xCC00FF00);
  plot("SAR",SAR(0.02,0.02,0.2),DOT,RED);
  ZigZag(Price,1*PIP,5,BLUE);

// plot some other indicators
  plot("ATR (PIP)",ATR(20)/PIP,NEW,RED);
  plot("Doji",CDLDoji(),NEW+BARS,BLUE);
  plot("FractalDim",FractalDimension(Price,30),NEW,RED);
  plot("ShannonGain",ShannonGain(Price,40),NEW,RED);
}
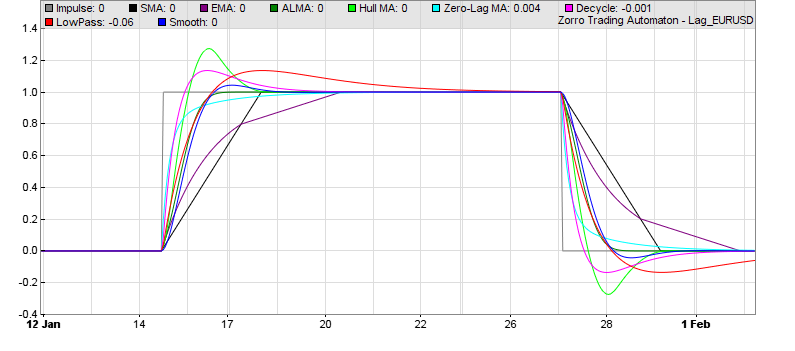
// compare the impulse responses of some low-lag MAs
function run()
{
  set(PLOTNOW);
  BarPeriod = 60;
  MaxBars = 500;
  LookBack = 150;
  asset(""); // dummy asset
  ColorUp = ColorDn = 0; // don't plot a price curve
  PlotWidth = 800;
  PlotHeight1 = 400;

  vars Impulse = series(1-genSquare(400,400));
  int Period = 50;
  plot("Impulse",Impulse[0],0,GREY);
  plot("SMA",SMA(Impulse,Period),0,BLACK);
  plot("EMA",EMA(Impulse,Period),0,0x800080);
  plot("ALMA",ALMA(Impulse,Period),0,0x008000); // best representation of the impulse
  plot("Hull MA",HMA(Impulse,Period),0,0x00FF00);
  plot("Zero-Lag MA",ZMA(Impulse,Period),0,0x00FFFF); // fastest MA with no overshoot
  plot("Decycle",Decycle(Impulse,Period),0,0xFF00FF); // fastest MA with some overshoot
  plot("LowPass",LowPass(Impulse,Period),0,0xFF0000);
  plot("Smooth",Smooth(Impulse,Period),0,0x0000FF);
}
See also:
Spectral filters, Time series,
Normalization, Candle patterns,
Machine learning
►
latest version online