optimize (var default, var min, var max, var step, var bias) : var
Optimizes a trading strategy parameter for the current asset and
algo combination. In [Test] and [Trade]
mode the function returns the previously optimized parameter value. In [Train]
mode the function performs an optimization process to find the most robust
parameter value between min and max.
Several optimization methods (Ascent, Genetic, Brute Force, Extern) are available through
TrainMode. The optimization target can be individually defined
with a user-supplied objective function. The optimization process
consists of many cycles. For every cycle the optimize function
generates a different value between min and max
and tests its effect on the strategy. At the end of the optimization, a parameter
chart is plotted that reveals the effect of a certain parameter on the strategy
(see below). The best
or most robust parameter values are then selected and stored in a .par
file.
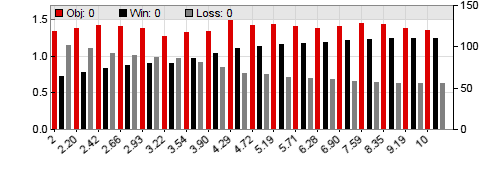
The chart above is a result of a parameter optimization with the
Ascent algorithm. The parameter is a stop distance. It varies from
2 to 10
in 10% steps. At any step the number of
winning trades (black bars), losing trades (grey) and performance
(red) of the parameter are displayed. We can see that high stop distances
increase the number of winning trades, but have only a small effect on the
overall performance. The Ascent optimizer would here likely select 8
as the most robust parameter value, rather than the single peak at 4.29.
This behavior can be changed
with TrainMode.
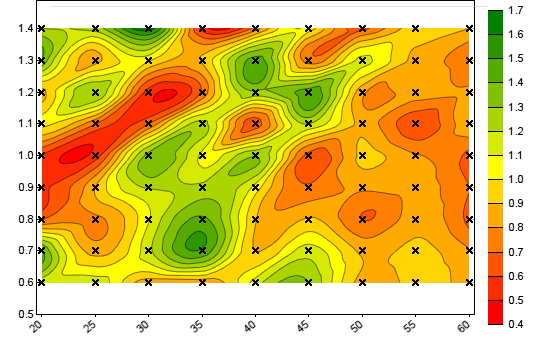
The contour chart above is generated by optimizing two parameters with the
Brute Force algorithm. The first parameter, a time period, runs from
20 to
60 in steps of 5; the second, a signal
threshold, from 0.6 to 1.4. Green areas indicate high performance, red areas
low performance of the parameter combination. The optimizer would here likely
select the 35 / 0.8 parameter combination. If more than two
parameters are optimized, the first two are used for the contour chart.
The size of parameter or contour charts can be set up with
PlotHeight2. By using multiple optimize calls in the code, any number of parameters
can be optimized (up to 16 per asset/algo component). The more parameters, the more trades are needed for a
meaningful optimization, and the longer will it take. As a rule of thumb, have
at least 40 trades per parameter and WFO cycle, and do not optimize more than 3 or 4 parameters
for a trade entry signal and 2 or 3 for exit. Too many optimized parameters generate an overfitted
strategy and reduce the out-of-sample performance. Dependent on the method, the best value
of a parameter can affect the optimization of the next parameters. If the script
contains loop calls,
a separate parameter set for the asset/algo combination in each loop is optimized.
Training also produces a log with the results of any training step. Here's an
example log of the first cycle of an Ascent parameter walk-forward optimization:
Walk[1] Bar 400..23372

Parameter 1 step 1: 0.10 => 0.96 1729/1933
Parameter 1 step 2: 0.20 => 0.91 1290/1540
Parameter 1 step 3: 0.30 => 0.87 990/1184
Parameter 1 step 4: 0.40 => 0.83 840/1034
Parameter 1 step 5: 0.50 => 1.06 747/759
Parameter 1 step 6: 0.60 => 1.01 669/715
Parameter 1 step 7: 0.70 => 0.87 604/712
Parameter 1 step 8: 0.80 => 0.86 490/616
Selected p1[5] = 0.504 => 0.96

Parameter 2 step 1: 1.00 => 1.06 471/1035
Parameter 2 step 2: 1.50 => 1.08 553/953
Parameter 2 step 3: 2.00 => 1.08 599/907
Parameter 2 step 4: 2.50 => 1.07 646/860
Parameter 2 step 5: 3.00 => 1.06 676/830
Parameter 2 step 6: 3.50 => 1.07 725/781
Selected p2[3] = 2.000 => 1.07

Parameter 3 step 1: 1.00 => 0.97 883/623
Parameter 3 step 2: 1.50 => 0.99 806/700
Parameter 3 step 3: 2.00 => 1.02 755/751
Parameter 3 step 4: 2.50 => 1.06 711/795
Parameter 3 step 5: 3.00 => 1.04 657/849
Parameter 3 step 6: 3.50 => 1.06 622/884
Selected p3[5] = 3.01 => 1.05

EUR/USD: 0.504 2.000 3.01=> 1.112

Parameters stored in OptTest_1.par
The log displays the first
walk-forward cycle (Walk[1]) with 3 parameters. The numbers after '=>'
are the objective return value and the numbers of
won and lost trades. The selected parameter value and its objective are
interpolated between steps. The second-last line, beginning with "EUR/USD:",
is the content added to the parameter file.
Parameters:
| default |
Default value of the parameter, returned when the
PARAMETERS flag is not set in [Test] or [Trade]
mode. This should be the estimated best value of the parameter, normally
in the middle of its range. Must be >= 0. |
| min, max |
Parameter range, minimum and maximum values (>=
0). For optimizing negative parameter ranges, subtract an
offset or add a minus sign to the optimize call. If
both min and max are 0, the default
value is
stored in the parameter file. |
| step |
Optional step width. If at 0 or omitted, in
Ascent
optimization 10%
is added to the parameter for every step; in Brute Force or
Genetic optimization
1/10 of the min..max range is added. A positive step
value is added at every step.A negative step
value is interpreted as a percentage to be added, for instance
-20 adds 20% per step (Ascent
optimization only). Using a percentage
gives a higher step resolution to smaller values at the begin
of the range. For best results, select the step value so
that every parameter has about 10..15 optimization steps. The recommended
minimum number of steps is 5, the maximum number of steps
(MAX_STEPS) can be found in trading.h. |
| bias |
Optional preference of low or high parameter values (Ascent
optimization only). When 0 or omitted, select the optimal
parameter. When > 0, prefer higher parameter values
even when their rank is lower by the given bias in percent.
When < 0, prefer lower parmeter values even when their
rank is lower by abs(bias) in percent. Preferring values
from the low or high range can make sense f.i. for setting a Stop
as tight as possible even when its value is not optimal. |
Returns
Current, default, or optimized parameter value, depending on training or test/trade
mode.
Remarks:
- A bit of optimization theory is described under Training;
for examples see Workshop 5 and
Workshop 6. More about optimization tricks
and traps can be found in the Black Book.
- All optimize calls must be placed either in the
run function or in functions that are called from the
run function. Since parameters are identified by the order
of their optimize calls, the order must not change between test and training or from one
run to the next. All flags and variables that affect optimization, such as
PARAMETERS, NumTrainCycles,
TrainMode, etc. must be set and an asset must be selected before the first
optimize call.
- In portfolio strategies, parameters
should be normally optimized separately
for any component. Use one or two loop() calls
to cycle through all used assets and algos. For optimizing asset/algo
specific parameters, place the
optimize calls inside the inner loop, and
make sure to select
asset and algo before. For optimizing
additional global parameters that do not depend on asset and algo,
place their optimize
call
in the very first loop run only, and store the parameter in a static or
global variable outside the loop. The global parameters are then assigned to the
first asset and/or algo. If asset/algo
specific optimization is not desired at all, don't use loop,
but enumerate the assets in a simple
for loop, f.i. for(used_assets) ...,
and optimize the parameters outside the for loop. Make sure in that case to select
all assets before the first optimize call; otherwise the optimizer
will assume a single-asset strategy.
- The optimization objective is calculated
from trade statistics by the
objective function in include\default.c.
This function can be replaced by any user provided function named objective
in the script. This way, arbitrary performance figures can be used for optimizing
parameters, for instance the profit/drawdown ratio, or the gross profit, or
the Sharpe ratio. The objective function can
access all trade statistics for determining the performance
value. By default, the function calculates the pessimistic return ratio (PRR)
with reduced influence of the biggest win and the biggest loss, a penalty for
few trades, and a 5 trades minimum.
- Optimized parameters are stored in .par files in the
Data folder. They are plain text files that contain the parameter
values in the order of their optimize calls. If
WFO was used, the WFO cycle is appended to
the file name. If optimize was called without selecting an
asset before, the file names contain the current
asset from the [Asset] scrollbox. This way different sets of .par files can
be generated with the same script by training different assets from the
AssetsFix list. The script must then not modify the
scrollbox by assetSelect or
assetList, otherwise inconsistent .par file names will
cause error messages. In that case make
sure to select a valid asset by script before the first optimize
call.
- In multi-asset or multi-algo strategies
the .par files contain the parameters for all asset/algo combinations,
and the
.par file name does not contain the asset name.
Each line in a portfolio .par file begins with the asset name and optional
algo identifier of the parameter set. The values
are listed in the order of the optimize calls in the script.
A '+' before a parameter value indicates that the best
value is at the end of its parameter range. In that case it could make sense
to extend the range for better results.
- If the PARAMETERS flag is not set, the
optimize call will return the default value in [Test]
or [Trade] mode, and a previously optimized
parameter from the .par file in [Train]
mode. This allows to temporarily switch off the PARAMETERS
flag for special purposes, such as a training run with FACTORS only.
- For eliminating distortions by money management, optimization uses normally
a fixed 1 lot trade size and includes
any phantom trades. Margin
or Lots have no effect, except when they are zero; in
that case no trade is opened. Training with individual lot sizes for special purposes can be
set up with the TrainMode variable.
- For best precision and proper display on charts, parameters should be
in the positive integer range, i.e. between 1
and 10000. Thus, 0.012345 or 1.23e45 would be no good parameter values. Multiply them with a factor when
smaller or higher numbers are needed. If a parameter has to be negative,
multiply it with -1 or subtract
a constant for getting a positive range. For optimizing in pre-defined individual steps, use an array and optimize
its index. Example: int Periods[5] = { 10, 20, 50, 100, 200 }; int Period
= Periods[round(optimize(1,0,4,1),1)];
.
- For using no optimization for a certain parameter, but
calculating it by script in the training run
instead, set min and max at 0 and
default at the calculated value (f.i. MyParameter =
optimize(MyCalculatedValue,0,0);). The default is
then stored in the .par file, This way parameters can be
generated in the training run that would be difficult to get in live
trading, for instance the average volatility of the last 10 years.
- Returned parameter values in Ascent mode are
not a multiple
of the step width. They can lie anywhere in the optimization range. Use the
round or floor functions when
optimizing an integer value.
- The bias value can be used when a high or a low value of
the parameter is preferred even though another value gives a slightly better
objective result (Ascent mode only). For instance, you might
prefer low stop distances to reduce the risk even when higher stop distances
give slightly better results.
- Parameters that affect the bar composition, such as
BarMode,
BarPeriod, or bar
ranges, cannot be directly optimized
because bars are generated at the begin of the simulation. If needed, optimize them
by script in several cycles, then enter
their optimal value directly in the script.
- When optimizing several parameters in Ascent mode,
put the most important parameters first. Parameters are optimized in the order
they appear in the code. For optimizing trade entry and exit parameters, optimize
entry parameters first and exit parameters afterwards. Use a distant exit as
default value for optimizing the entry. When your exit system
is very complex, optimize entry parameters with a simplified exit such as a
distant
stop. For using a different exit system while the entry parameters are optimized, evaluate
the current parameter number (ParCycle),
f.i. if(Train && ParCycle <= NumParameters-3) setExitSimple();.
- When parameters affect each other - for instance, two time periods for a crossover
of two moving averages - optimize only one time period, and optimize a multiplication
factor for the other (see the example below). This way the other time period
also changes when the first one is optimized.
- Special cases when RULES and PARAMETERS
have to be optimized at the same time are described under
Training. For optimizing parameters several times,
use NumTrainCycles. The current optimization cycle can be evaluated with the
ParCycle and
StepCycle
variables. Optimization can be aborted by setting StepNext
to 0. This will end optimization of the current parameter after the current cycle.
- When optimizing a time period of an indicator, make sure that
LookBack is set at least to the maximum
period plus the UnstablePeriod (f.i. LookBack = max(LookBack,300);).
Otherwise LookBack will automatically adapt to the period of
the current parameter value. This would affect the result in an unexpected way
because the backtest period would then get shorter when the time period gets
longer.
- For avoiding randomness, slippage is not simulated
during optimization. Rollover is simulated; it can
have a large effect on the result and produce long/short asymmetry in parameters
and profit factors. For eliminating rollover asymmetry, you can set
RollLong/Short to 0 after calling
asset in training mode. For eliminating trend asymmetry,
detrend the price curve in training mode. Even without
rollover and trend, some commodities and stocks still require different parameter
sets for long and short trades due to inherent asymmetries in their price curves
(long trades are often dominant).
- When the strategy opens no trades at all in [Train]
mode - f.i. when no trade signal is generated or when Margin
or Lots is zero - the default values
are stored in the parameter file.
- The profit/loss curves of every optimize
step can be exported in a file for further evaluation when a
Curves file name is given. A curve is only exported
when the objective function returns a nonzero value. A CSV
file with all parameter combinations and their objectives are exported in
brute force, genetic, or extern optimization mode when
LOGFILE is set. Parameter charts are
generated when LOGFILE is set and multiple
cores or multiple cycles
are not used. The height of the parameter charts can be controlled with
PlotHeight2.
- While training, trades are normally not logged. For
logging the trades of a particular training
cycle, use the LogTrainRun variable.
Examples:
// trend trading with Moving Averages and optimized parameters
function run()
{
  set(PARAMETERS);
// for optimizing time periods, set the LookBack variable to the
// maximum possible value (here, TimeCycle 100 * TimeFactor 5)
  LookBack = 100*5;

  var TimeCycle = optimize(30,10,100,5);
  var TimeFactor = optimize(3,1,5);
// allow 3% tolerance for preferring low stop distances
  Stop = ATR(10) * optimize(3,1,10,0.5,-3);

  vars Price = series(price(0));
  vars MA1 = series(SMA(Price,TimeCycle));
  vars MA2 = series(SMA(Price,TimeCycle*TimeFactor));
  plot("MA1",*MA1,0,BLUE);
  plot("MA2",*MA2,0,BLUE);

  if(crossOver(MA1,MA2))
    enterLong();
  else if(crossUnder(MA1,MA2))
    enterShort();
}
See also:
Training, TrainMode,
loop, NumParameters,
NumTrainCycles, Workshop
5, Statistics
►
latest version online