A click on the [Result] button after a test run opens the chart viewer and debugger. It allows to zoom and scroll from an overview of the whole simulation down to a single day or hour, and can replay or single step through the strategy for debugging purposes. Charts can be exported and stored as images, or already generated as images..
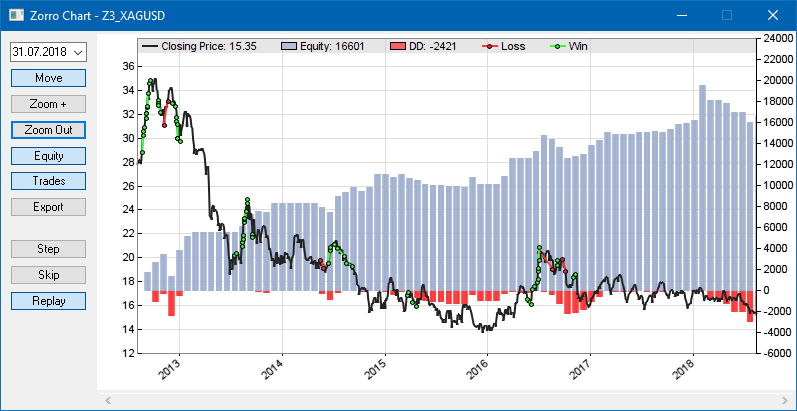
The chart runs from the begin of the first test cycle (not identical to the StartDate) to the end of the last test cycle. By default it displays equity and drawdown profiles (blue and red), the price curve (black), and the trades of the asset selected with the [Asset] scrollbox. For displaying a different asset, select it with the scrollbox and click [Result] again.
The chart uses the same time zone as the historical data, normally UTC. The left axis is the asset price, the right axis is the profit or loss in account currency units. Any axis runs from the minimum to the maximum value within the chart. Trade entry and exit points are connected with green or red lines for winning or losing trades. A falling green line or a rising red line indicates a short position. For option trades the lines connect the strike prices with underlying exit prices.
Equity and drawdown profiles are summed up from the whole portfolio and averaged over all oversampling cycles. If Capital is invested, it adds to the equity curve dependent on PlotMode settings. In BALANCE mode the blue profile displays the balance rather than the equity, in PIPRETURN mode it's the volume-independent profit in pips. The red "underwater profile" is normally the drawdown, the equity distance from a preceding balance peak. In MAECAPITAL mode it's the adverse excursion from a preceding equity peak and thus 'mirrors' the top of the equity curve. In PL_BENCHMARK mode the equity curve is plotted as a blue line rather than bars, for comparison with buy-and-hold or market profit lines. Additional curves appear either on or below the main chart, depending on plot settings.
Candles are displayed when zooming in; otherwise the price curve is a black line. In the chart below, a short trade was opened on 16 at market open and closed intraday on Aug 8, probably by a trailing stop. A close at bar end by an exit command would have placed the end dot next to the close of the candle.
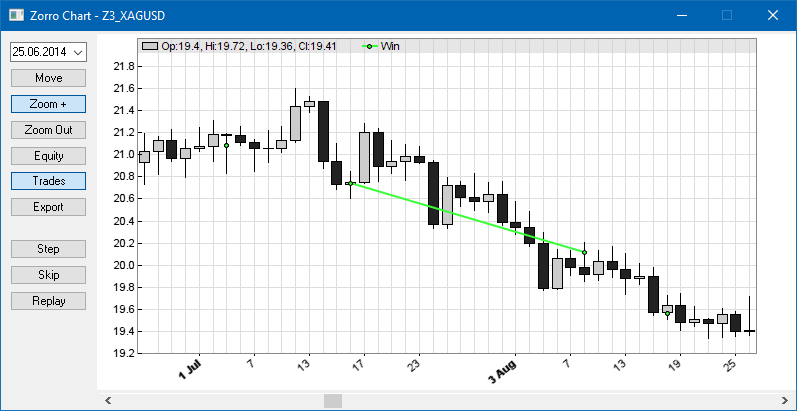
Chart elements can be switched off either with the buttons on the left side,
or by setting their Color to 0.
| ||||||||||||||||||||||||||
The price curve with the displayed trades can be selected with the [Assets] scrollbox; afterwards click [Result] again for refreshing the chart. The equity or balance curve results from the sum of all trades of the portfolio. The underlying datasets of a chart can be exported and further evaluated with third party charting software, f.i. an R data analysis package.
In PL_FILE mode, the chart is initally generated as a .png image in the Log folder and displayed with the ZView image viewer. Elements can be removed from the chart image by setting their corresponding Color parameters to 0. The size, scale, and resolution of the chart image can be set up with plot parameters. The number of bars per chart can be limited with the PlotBars variable.
You can replay or single step through a strategy for examining the trade behavior in detail. Use the [Asset] scrollbox to select the asset to be observed, then click [Step] or [Replay] for stepping through the backtest or replaying it in reduced speed. [Step] moves one bar forward, [Skip] moves to the next bar at which a trade opens or closes. The two buttons also appear on the Zorro main window.
Debugging opens the chart window at the current position, and another window with a list of open trades:
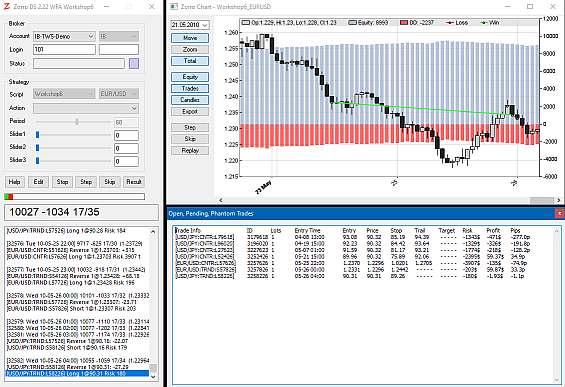
The trade list has the same format as on the live status page.
The stepwise change of variables and indicators can be visualized either with a watch statement, or by plotting them in the chart. For debugging single loops or function calls, place watch ("!...", ...) statements inside. [Step] will then not proceed to the next bar, but to the next watch statement. Stepwise debugging normally begins at the end of the LookBack period. For beginning at a certain date or bar number, call watch dependent on a condition, f.i. if(date() >= 20150401) watch("!...", ...);. Set the STEPWISE flag for starting the backtest already in debugging mode.