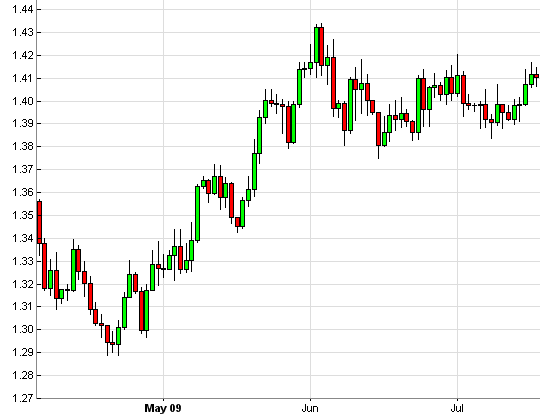
The behavior of an algorithmic trading strategy is determined by bars or by ticks - often by both. A bar is normally a fixed time period, like one minute or one day. In the chart below that displays the EUR/USD price curve in summer 2009, every bar is represented by a red or green candle. The horizontal width of the candle is the bar period - here one day - and its vertical height is the price movement of the asset during that period. On green candles the price went up during the bar period; on red candles it went down. By default, Zorro displays up and down candles in white and black colors. The thin lines above and below the candles - the 'wicks' - represent the highest and the lowest price during the bar period.
For example, when you look at the candle of June 1 (at the vertical line below marked Jun), you see that the day started at a price of 1.4125. During the day the price went as high as 1.4225, and as low as 1.4110. The day ended with the price at 1.4135.
In past times, a bar was really equal to a day. The closing price was the price of the asset in the afternoon when the market closed, and the opening price was the first price next morning at 9:30 after the traders had contemplated their strategies all night. In modern times, many assets are traded online 24 hours a day, and some, such as digital coins, even at weekends and holidays. Due to the trading around the clock, you can see that in the above chart the closing price of one bar is almost identical with the opening price of the next bar. This is different when an asset is traded at a single stock exchange and has little or no trading volume outside its business hours. In that case, daily candles have a gap between the close of a bar and the open of the next bar.
The same price curve can look very different depending on the used trading platform or charting program - especially with forex pairs or CFDs that are traded around the clock. The reason are different time conventions. The open, high, low, and close price of any candle depends on the time zone of the charting software and of the open/close time of the bars. The EUR/USD chart above is based on Greenwich Mean Time (GMT, UTC). The same chart in New York local time (EST) had quite different candles. By Zorro convention, charts and logs are always in UTC time, and the time stamp of any bar is the current time at bar end. Thus, a 12:00 bar ends at 12:00 UTC. This avoids 'peeking bias' when the close price of a bar lies in the future. Some trading platforms stamp the bar with the time from its begin or center, and some use local time or EST time. Be aware of that when comparing logs or charts of different platforms.
In charts a candle is usually printed centered about its timestamp, not in front of it as would be correct. And indicators are usually printed with smooth lines, not with discrete steps at any candle as would be correct. Therefore, the begin and end of candles and the crossings of indicators normally look slightly off in charts. This can confuse beginners. For getting the exact position of indicator crossings, don't use a magnifying glass on the chart, but look in the backtest or trading log.
Trading algorithms can be based on ticks, bar periods, and time frames. The main strategy runs at any bar, but it can also have a tick function that runs at any incoming tick. In live trading, a tick is the arrival of a new price quote; in the backtest, a tick is a single record in a historical price data file. Any tick got a timestamp from the exchange or broker where it originated. Any bar contains all ticks whose timestamps fall into the bar period. When one bar ends, the next bar begins; there are no 'gaps' between bars. A 1-hour bar ending at 12:00 contains all ticks with timestamps greater than 11:00:00 and less or equal to 12:00:00. A tick with the timestamp 12.00:00.001 already belongs to the 13:00 bar, even though it might display in a spreadsheet or history editor as 12:00:00. Zorro timestamps have a precision of 100 microseconds.
Since ticks arrive rarely or not at all during weekends or holidays, and since Zorro allows bar periods down to 1 millisecond for HFT simulation, a bar period can be shorter than the time between two subsequent ticks. The bar is then normally extended by a multiple of the bar period until it contains at least one tick. Consequently, bars are normally also extended by weekends, holidays, or market closure. Different behavior can be set up with BarMode flags.
A time frame can cover several bars, and is used as a time basis for technical indicators and for price series. A strategy has only one bar period, but can use any number of different time frames. For instance, TimeFrame = 4 merges 4 subsequent bars to a single time frame, and TimeFrame = framesync(24) merges all 1-hour bars that belong to a full day. Bars be be merged by any criteria or condition set up in the script, allowing time frames to be synchronized to certain events. Since many assets are traded in sessions and have no or infrequent price quotes outside their market hours, it is normally desired to merge out-of-market bars to a single bar. Alternatively, time series can ignore out-of-market bars when the NOSHIFT flag is set during that time.
Some traders believe that they get a better insight into the market with bars that cover not a fixed time period, but a fixed price movement. With a focus on price movement, long periods of consolidation are condensed into just a few bars, thus highlighting "real" price trends. There are many special bar types: Tick Bars, Renko Bars, Range Bars, Momentum Bars, Point-and-Figure Bars, or Haiken Ashi Bars. Their usefulness for algorithmic trading is doubtful, but Zorro allows any imaginable combination of price and time for constructing user-defined bars with the bar function.
Strategy development involves testing the strategy with historical price data. The prices are read from files in Zorro's History folder. For keeping the files at a reasonable size, they normally do not contain all the price quotes, but only one-minute candles (M1 data) or daily candles (D1 data). Files containing no candles, but direct price quotes (T1 data), can also be used for special purposes, like testing scalping or HFT strategies. Historical data should have at least the same resolution as the bar period, but preferably higher resolution.
Historical M1 data for main currencies, indices, and commodities is available on the Zorro Download Page. Data that is not found there can be downloaded (usually free) from brokers or from Internet data providers (Google™, Quandl™, etc.). Data in high resolution or with special content - for instance, option chains - is normally not free. It can be purchased from data vendors; we also provide M1 price data and EOD options data for US stocks and ETFs in the Zorro data format. Other vendors specialize on certain data types or exchanges - for instance, iVolatility™ on options and futures, Nanotick™ on Chicago traded assets, or Nanex™ on New York traded assets. Most have data in CSV format that can be convert to Zorro's data formats using the dataParse function with a special format string. Examples for conversion scripts can be found in the Strategy folder.
Bars, candles, ticks, or quotes are often confused, and the meanings of those terms can also vary from platform to platform. Throughout this manual the following terms are used:
Asset - the traded financial product. Multiple synonyms are used in the trading literature, such as Instrument, Ticker, Symbol, Issue, Market, or Security.
Quote - online offer by a market participant to sell or buy an asset at a certain price. The most recent price quote is the current bid or ask price of an asset. Sometimes other methods are used to define the current price, for instance the best recent quote or the last traded price.
Tick - a price in combination with a time stamp. In live trading, a tick is generated by an incoming new price quote. In historical data files, a tick is a price sample with its associated time. If a tick is sampled together from several quotes, as in most historical data files, its time stamp is the time of its most recent quote.
Candle - price info covering a time interval with an open, close, high, and low price. T1 data contains only a single price quote per tick, so its open, close, high and low is the same price. Price ticks in historical files are usually candles with the first, last, highest, and lowest price of all quotes they are sampled from. Forex, CFD, or cryptocurrency candles from different brokers often differ strongly.
Bar - basic time interval. The bar period determines the width of a candle, the time resolution of the price curve, and the execution interval of a trading strategy. The time scale on a chart is divided into bars that cover at least one tick, but normally many ticks. The bar time can vary from bar to bar when special bar types, such as Range, Renko, or Point-and-Figure bars, are used, or when bars are extended due to weekends, holidays, or market closure.
Intrabar - inside a bar. Simulating intrabar events in test/train mode requires the TICKS flag. The tick or tock functions or trade management functions can run at any time inside a bar.
Time frame - basic time unit of algorithms and indicators in a trading strategy. It is often identical to a bar, but can also cover multiple bars in multi-timeframe strategies. A time frame can be synchronized to a full hour, day, or week. In that case the number of bars per time frame can vary.